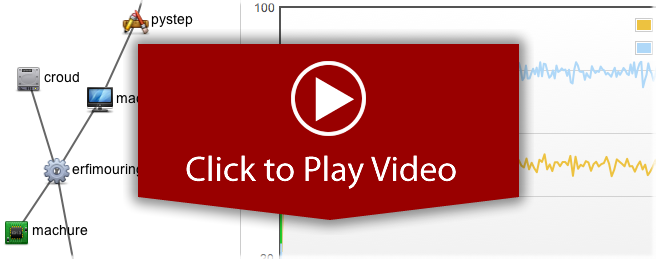
This page serves to showcase a prototype user interface for configuration and performance monitoring data. The web-based UI was built with the goal of highlighting a sample use case of the data exposed by vQuery: root-cause diagnosis. With current tools, it is often difficult to trace back a problem in one layer of infrastructure to the related entities that may have caused it. A tool like the one shown here can enable users to quickly trace these dependencies and hide portions of infrastructure that are not relevant to the problem at hand.
This interface is just one application of historical information delivered with interactive speed. For example, other semi-automated and automated diagnosis tools, analysis applications, and research queries can use this data.
Demonstration Dataset
 |
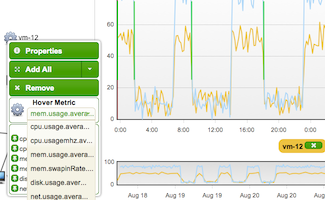 |
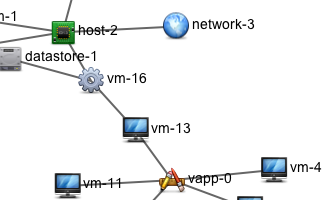
| Dependency Traversal: easily explore and visualize shared infrastructure | Linked Views: connect configuration and performance data with hover and overlays |
Real Cloud Data
These screenshots were taken from use of the tool with data the system collected from a production cloud.
 |
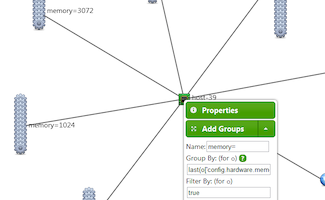 |
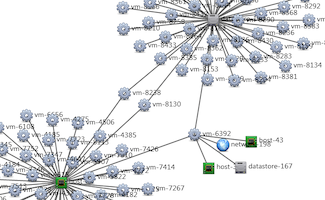
| It is easy to create a view of entities (here: VMs) that share dependencies (here: host and datastore)... | ...and to create a more manageable view, users can create aggregates based on custom groups + filters. |
 |
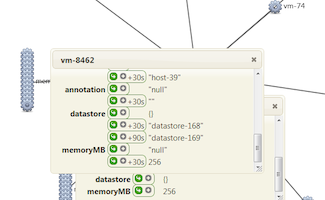 |
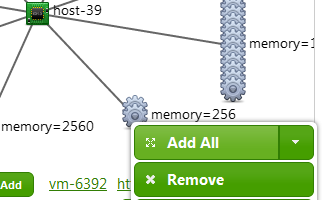
| Suppose we are interested in VMs with only 256MB of RAM; we can expand the group... | ...and examine the history of configuration changes to each of the members (vm-74 and vm-8462) |

